
Get In Touch
FOMO WORKS, Grenseveien 21,
4313 Sandnes, Norway.
+47 92511386
Work Inquiries
Interested in working with us?
career@kilowott.com
+91 9765419976
Social media case study

Four posts, ₹4,609.60, and one clear lesson

A twelve-week Meta campaign for Models Oddavell — what each creative cost, what it actually bought, and the one format that outperformed everything else in the account.

PartnerModels Leisure Ventures Pvt. Ltd.
ChannelsFacebook, Instagram
Period19 May – 12 August 2026
Scope4 posts · 7 creatives · 8 boosts
Total spend₹4,609.60
₹4,609.60
Total media spend across eight boosts
Ads Manager
20,574
Paid engagements
Ads Manager
₹0.19
Blended cost per engagement
Ads Manager
₹30.12
Blended CPM
Ads Manager
01 — What ran

Eight boosts, two objectives, no control group

Four posts went out between 19 May and 12 August. All four were boosted, and the boosts ran sequentially rather than concurrently across roughly three months.

Two things follow from that, and they bound everything below. There is no organic control anywhere in the set — nothing here shows what this content does unsupported, so no claim about organic performance can be made from it. And because the boosts are spread over twelve weeks, seasonality, audience fatigue and auction conditions all differ between them; cross-post comparison is indicative, not controlled.

The second column matters more than it looks. Six boosts were bought against post engagements and two against Facebook Page visits. Those are different products, and judging one by the other’s metric is the single most common way to misread this campaign — see section 05.

How the money was bought
PostPlatformObjectiveSpend
1FacebookPost engagements₹385.92
1InstagramPost engagements₹577.58
2InstagramPost engagements₹742.82
2InstagramPost engagements₹1,095.26
3InstagramPost engagements₹863.09
3FacebookPage visits₹399.96
4InstagramPost engagements₹334.17
4FacebookPage visits₹210.80
Eight boosts₹4,609.60

Post 2 ran no Facebook boost at all. Money figures throughout this page come from Ads Manager; saves, shares, comments and follows come from post insights. The two systems disagree on delivery by 1–391%, so no number here divides one by the other.

02 — The creatives

Seven pieces of artwork, four posts

Tile size reflects performance, not chronology: the carousel earned the largest frame.

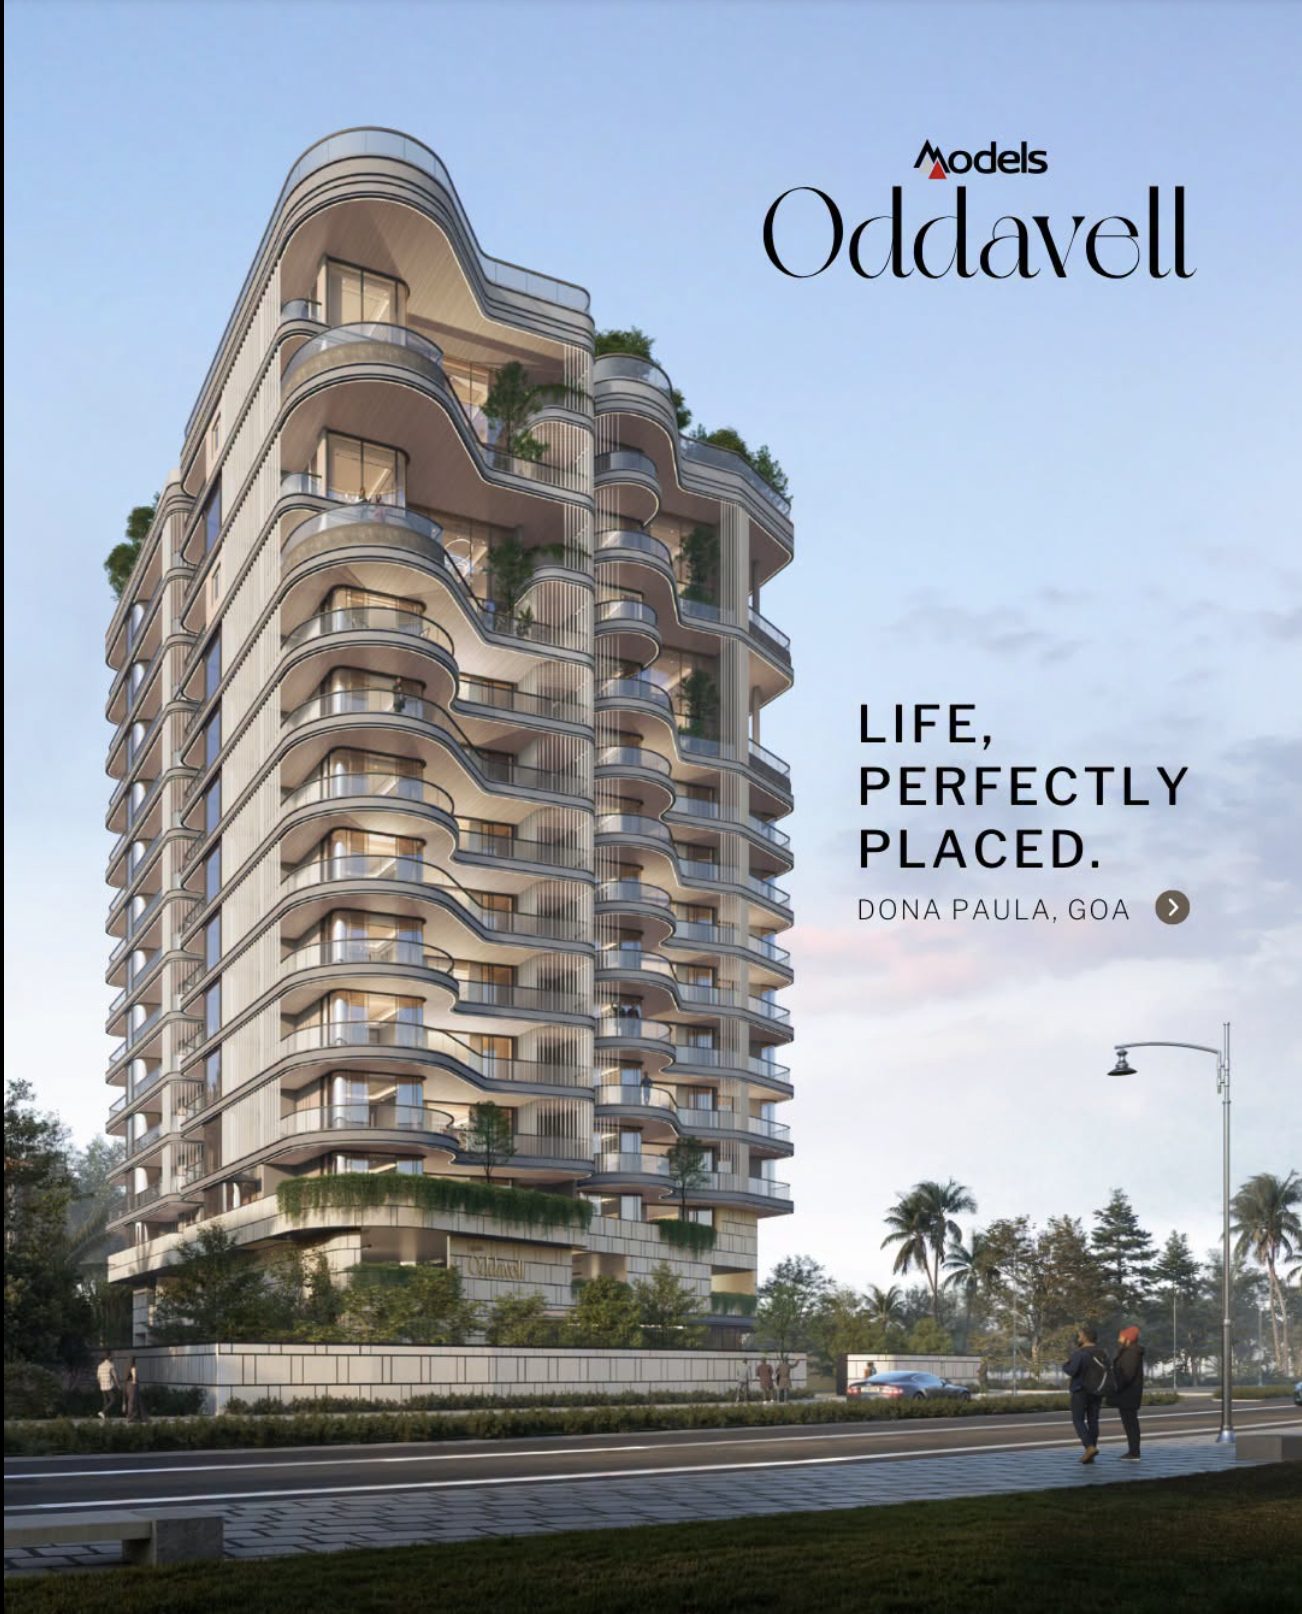
Post 2, slide 1 — Life, Perfectly Placed. Exterior render with the Dona Paula, Goa locator.
Post 2 · carousel, four slides

Life, Perfectly Placed.

Slide one sells the building; slides two to four name what sits within 5, 10 and 15 minutes. It absorbed 40% of the budget, returned the cheapest engagement in the account and produced 86% of the campaign’s saves — and it carried no link.

Cost / engagement₹0.14 Saves51 Follows14 Spend₹1,838.08

Post 1 — Your Spaces, Shaped by Light and Air. Low-angle façade crop against a graded sky.
Post 1 · single

Your Spaces, Shaped by Light and Air

Cost / engagement₹0.39 Saves6
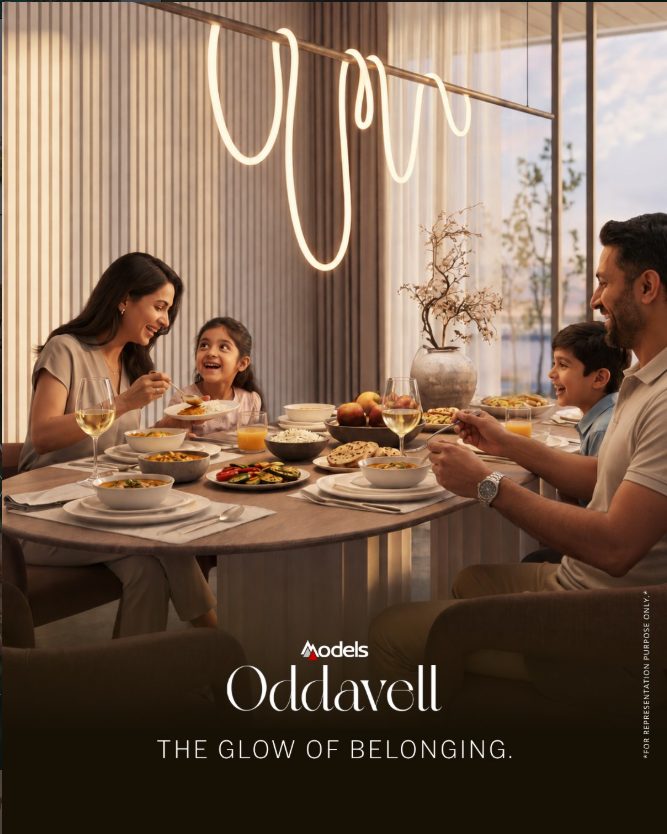
Post 3 — The Glow of Belonging. A family at a dining table under a looped pendant light.
Post 3 · single

The Glow of Belonging.

Cost / engagement₹0.23 Link clicks388
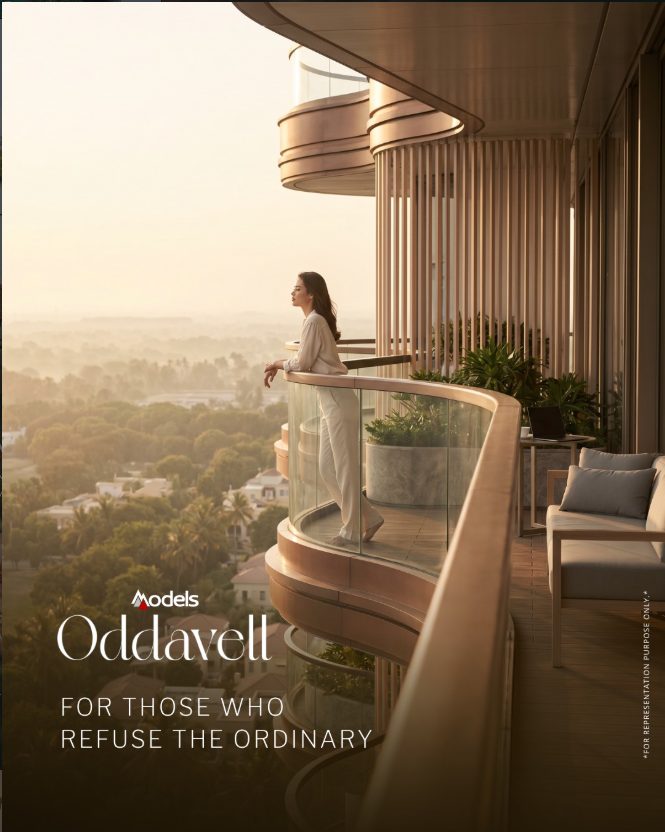
Post 4 — For Those Who Refuse the Ordinary. A woman on a curved balcony at golden hour.
Post 4 · single

For Those Who Refuse the Ordinary

CPM₹5.86 Cost / engagement₹0.36 Saves1 Reached57,526
Creative and figures · Meta Ads Manager and post insights, 19 May–12 Aug 2026
03 — Efficiency

Nobody bought cheap attention and cheap action

Each post’s Instagram post-engagement boost, plotted. That is the only like-for-like set in the campaign — the two Facebook buys were bought for a different product entirely.

Cheaper action ↑
IdealCheap attention, cheap action — empty
Expensive attention,
cheap action
Cheap attention,
expensive action
Worst of both — empty
Post 2 ₹0.14
Post 3 ₹0.23
Post 4 ₹0.36
Post 1 ₹0.38
₹5.86 CPM — cheap attentionCost of attention →₹76.97 CPM — expensive
Ads Manager · Instagram post-engagement boosts only · 19 May–12 Aug 2026

The two extremes sit in opposite corners. Post 4 bought the cheapest attention in the account — a ₹5.86 CPM, roughly six times cheaper than the next-best Instagram buy — and converted 1.9% of the people it reached. Post 2 paid thirteen times more per impression and returned engagement at ₹0.14, the cheapest in the set.

Nothing lands in the top-left quadrant. Cheap delivery and productive delivery were inversely related across this whole campaign.

The practical consequence

Optimising this media buy on CPM alone would have selected exactly the wrong creative. Post 4 looks like the best buy on every impression-based measure and produced the least. Judge on cost per engagement and cost per save instead.

04 — What the carousel proved

Specific beat beautiful, by roughly three to one

Post 2 · four-slide carousel

A drive-time ladder

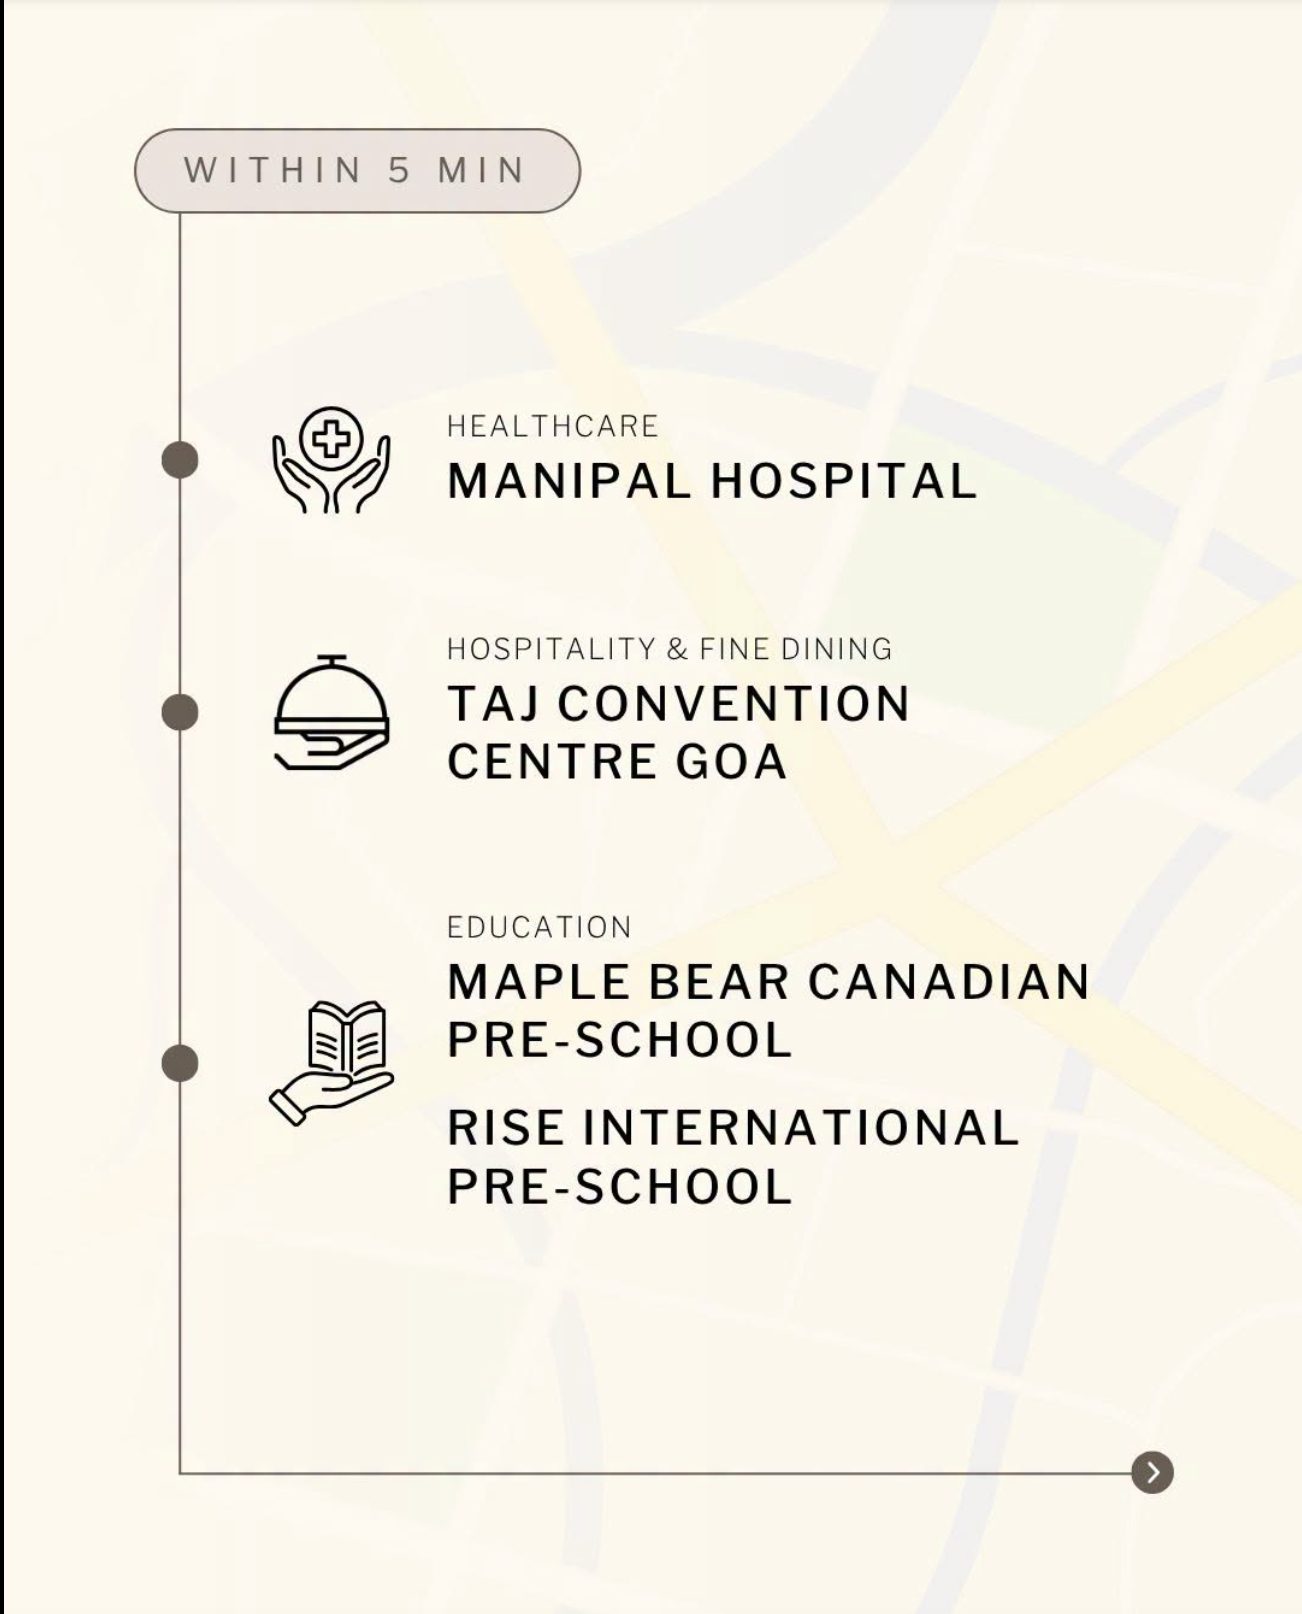
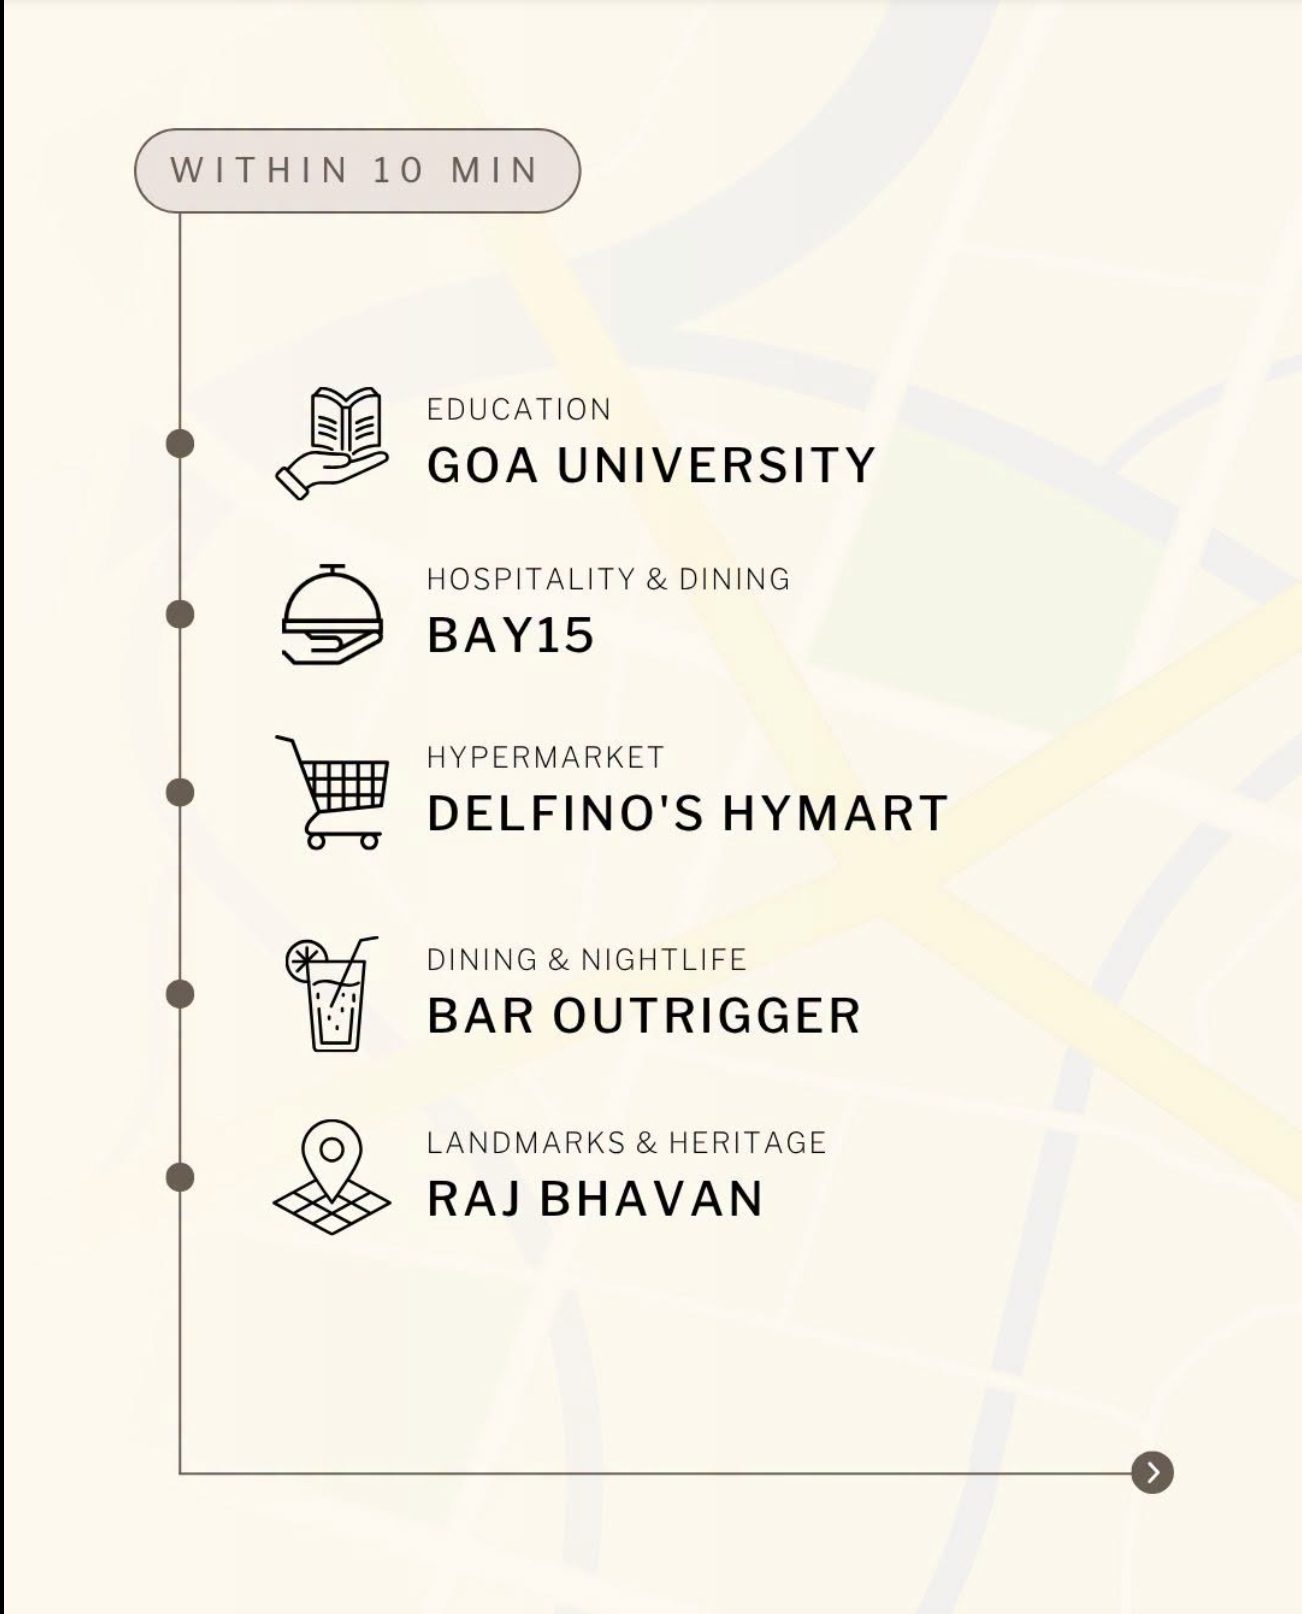
Slide one sells the building. Slides two, three and four list what sits within 5, 10 and 15 minutes — Manipal Hospital, Goa University, Miramar Beach, Raj Bhavan — named individually, by category.

Spend₹1,838.08
CPM₹76.97
Cost / engagement₹0.14
Saves51
Follows14

Most expensive attention. Cheapest action. 86% of every save in the campaign, at ₹36.04 each.

Post 4 · single image

A brand statement

A woman on a curved balcony at golden hour, carrying the wordmark and the website’s own hero line. Reached more people than any other post on the smallest budget in the set.

Spend₹544.97
CPM₹8.15
Cost / engagement₹0.36
Saves1
Follows7

Cheapest attention anywhere in the account. Zero comments. The creative travelled cheaply and stopped nobody.

Ads Manager & post insights · 19 May–12 Aug 2026
Post 2, slide 2 — Within 5 minutes: Manipal Hospital, Taj Convention Centre Goa, Maple Bear and Rise International pre-schools.
Slide 2 — within 5 minutes
Post 2, slide 3 — Within 10 minutes: Goa University, Bay15, Delfino's Hymart, Bar Outrigger, Raj Bhavan.
Slide 3 — within 10 minutes
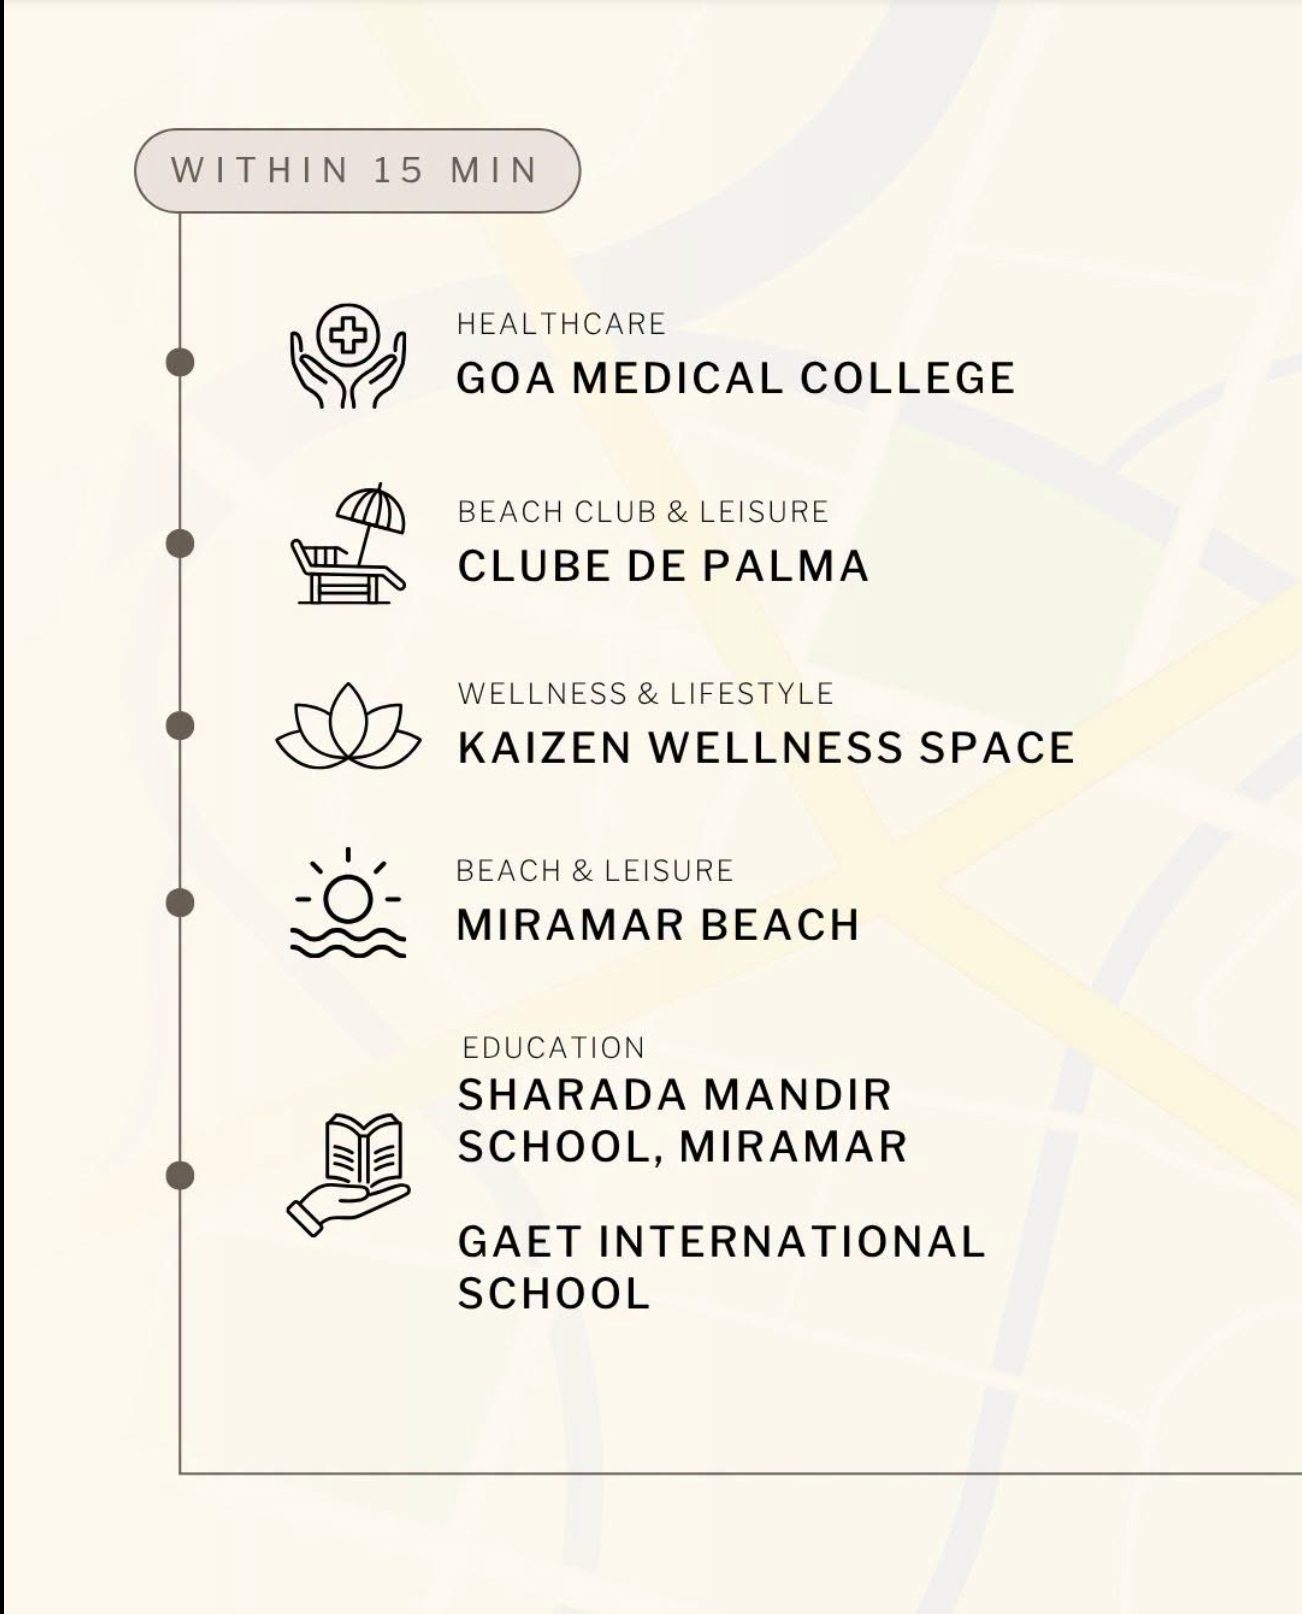
Post 2, slide 4 — Within 15 minutes: Goa Medical College, Clube de Palma, Kaizen Wellness Space, Miramar Beach, two schools.
Slide 4 — within 15 minutes

Read the saves, not the likes. Post 2 produced 51 saves against 11 comments. People filed the drive-time ladder to look at again rather than discussing it — which is the correct behaviour for reference content, and the strongest intent signal available for a purchase this size.

The single most efficient line item anywhere in the account was Post 2’s 9 July boost: ₹0.12 per engagement against a 7,790-person audience.

The lesson generalises past this campaign. Informational, specific, multi-slide content converted attention into action at roughly three times the rate of single-image brand statements, which ran ₹0.36–₹0.39.

None of that came cheap per impression. Post 2 had the highest CPM in the set. It was not cheap attention; it was attention that did something.

The most expensive mistake in the set
₹1,838.08

Posts 1 and 2 shipped with no link in the post at all, and recorded zero link clicks between them. The best-performing creative in the campaign — the one that absorbed 40% of the budget and generated 86% of its saves — had no route to the landing page. That is demand generated with nowhere to send it, and the 51 saves are what that audience did instead, because there was nothing to click.

05 — The platform question

Facebook looks dead until you check what it was asked to do

Facebook delivered the majority of impressions and almost none of the interactions. Read alone, that is damning. Read against the objectives, it is the media plan working as specified.

Views delivered62,908 total
Facebook 59%
Instagram 41%
Interactions earned17,816 total
Instagram 98.6%
FacebookInstagram
Meta post insights · 19 May–12 Aug 2026

On Posts 3 and 4 the Facebook budget was bought for Page visits, not engagement. Low interaction counts there are the specified outcome, not a failure — and that spend delivered 927 Page visits at ₹0.66 each.

The one genuine like-for-like test is Post 1, where both platforms were bought against post engagements. The result: Facebook ₹0.41, Instagram ₹0.38. CPM ₹55.26 against ₹49.37. Instagram was marginally better, not categorically better.

So the common read — that Facebook spend does nothing here — is not supported once objectives are visible. What is supported is narrower: stop judging Facebook on engagement metrics while buying Page visits on it.

Two numbers that must stay apart

Those 927 Page visits are visits to the Facebook Page, not to the website, and not link clicks. The campaign separately recorded 555 link clicks. They are different actions measured by different systems and must never be added together.

06 — What we’d change

Five changes, in order of value

  1. Put a link on every boosted post.Retrofit one to the Post 2 format before it runs again. That post proved demand and had no destination — the single most expensive error in the campaign.
  2. Reallocate toward the carousel.At ₹0.14 per engagement it is the most efficient creative in the account. Single-image brand statements run ₹0.36–₹0.39.
  3. Stop optimising on CPM.Post 4’s ₹5.86 CPM was the cheapest and least productive buy in the set. Judge on cost per engagement and cost per save.
  4. Report Facebook against what it bought.Either run a like-for-like engagement test on Facebook, or report its Page-visit result — 927 visits at ₹0.66 — as the deliverable it actually was.
  5. Investigate the Post 4 audience.48,520 people at ₹5.86 CPM is unusually cheap delivery. It may be a broad, low-intent audience worth keeping for awareness and excluding from conversion campaigns.
Read these figures with the caveats

Every figure on this page is transcribed from static screenshots of Meta Business Suite and Ads Manager — there is no export or API pull behind them, and no way to re-query the source.

Reach is summed across platforms and is not de-duplicated: someone reached on both Facebook and Instagram counts twice, so 125,549 is a sum rather than a count of unique people. Likes are shown rounded by Meta (1.4K, 12.0K, 3.3K) and reproduced as such. Post 1’s insights screenshot is cropped and its link clicks are taken as zero from the top-line strip. Spend is as-billed and excludes agency fee, production and taxes. Boosts were not concurrent, so cross-post comparison across a twelve-week span is indicative rather than controlled.

What’s next

The cheapest reach was the worst buy

Most social reporting stops at reach and engagement rate. This one names the format that worked, the buy that didn’t, and the ₹1,838.08 that had nowhere to go.

Start a project

Sourcing

Meta Ads Manager delivery rows and Meta Business Suite post insights, 19 May – 12 August 2026. Money figures come from Ads Manager; saves, shares, comments and follows from post insights. The two systems disagree on delivery by 1–391%, so no figure on this page divides one system’s value by the other’s.

Every post in the set was boosted, so no figure here describes organic performance.

Norway

Kilowott AS
Haugstentunet 16,
1637 Gamle Fredrikstad
+47 92511386

India

Nordic Intent
Lane 4, PDA Colony,
Porvorim, Goa
+91 9850950259

USA

Kilowott USA LLC
317 North Layton Ave
Wyoming, DE 19934

Sales Inquiries

Got a project to discuss?
sales@kilowott.com
+91 91452 46464

Norway

Kilowott AS

FOMO WORKS,
Grenseveien 21,
4313 Sandnes, Norway.
+47 92511386

U.A.E.

Kilowott DXB
Meydan Grandstand,
6th floor, Meydan
Road, Nad Al Sheba,
Dubai, U.A.E.

Career Inquiries

Interested in working with us?
career@kilowott.com
+91 9765419976

© 2026, Kilowott

All rights reserved.

© 2026, Kilowott I All rights reserved.

This website stores cookies on your computer. Cookie Policy

Please Submit your Current CV